SENDIASS Evaluation of the Service April 2019-20
National Comparison
The Minimum Standards for Information, Advice and Support Services emphasise the importance of assessing the outcomes of the work done by Information, Advice and Support Services (IASS). One of the key sources of evidence is feedback from service users. Historically IASS (formerly Parent Partnership Services) have always used a variety of methods to seek feedback from service users. This has included the use of post intervention questionnaires, telephone interview, focus groups, suggestion boxes, and analysis of complaints. Some of these methods are inevitably idiosyncratic and it would be difficult to attempt to collate the results at a national level. However some kinds of outcome assessment are relatively straightforward to standardise. Following a period of consultation the IASS Network developed a set of 6 core questions that all IASS were then asked to incorporate into their service user feedback questionnaires.
Nationally SENDIASS services include a range of relatively small IASS serving unitary authorities through to IASS covering large shire counties and more than one authority. They also include in-house and out-sourced IASS.
In July 2019 National IAS asked all services to submit at least 30 pieces of service user feedback from the feedback they have been collecting over the course of the year. They received feedback from: 87 services Of these:
-
4624 total responses
-
3528 from parents
-
27 from children (0-16)
-
146 from young people (16-25)
-
923 unspecified
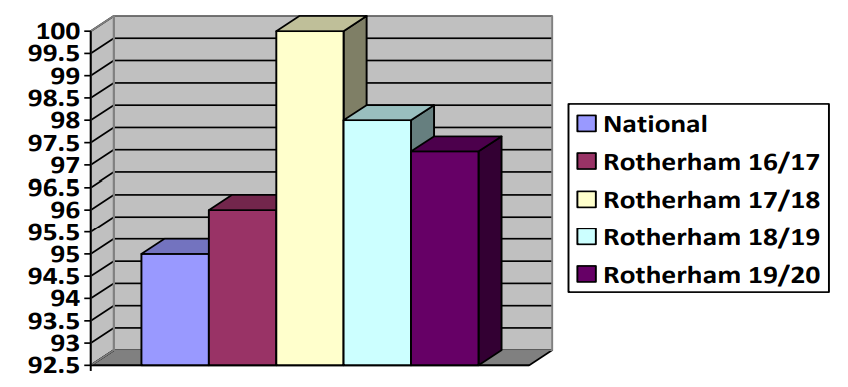
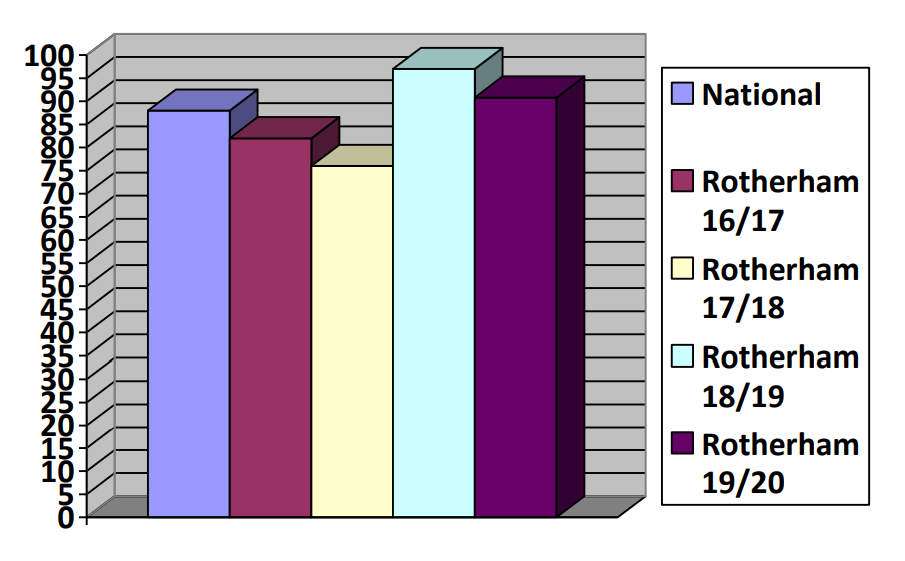
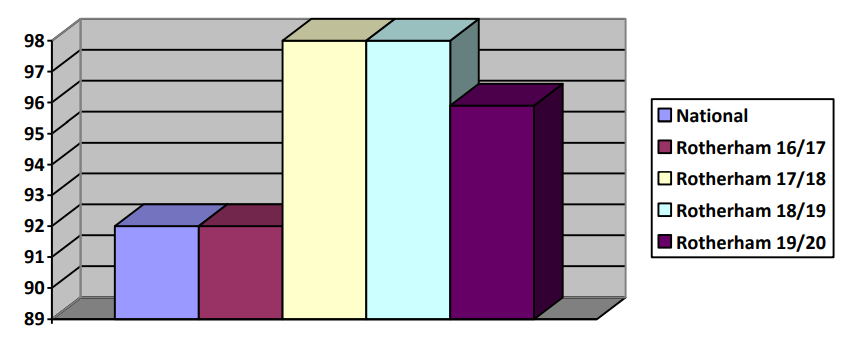
Comparison of services from 19/20 to Rotherham SENDIASS 16/17 and 17/18, 18/19 and 19/20 on the six specified questions
Percentage of parents who felt it was easy to get in touch
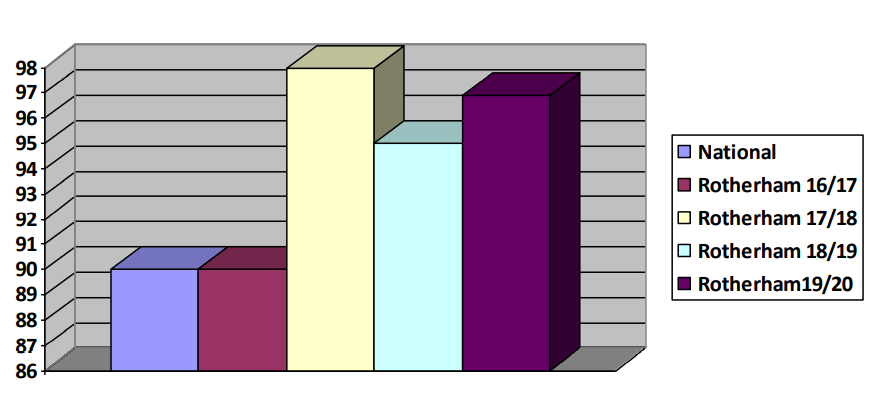
Percentage of parents who felt the information given was helpful
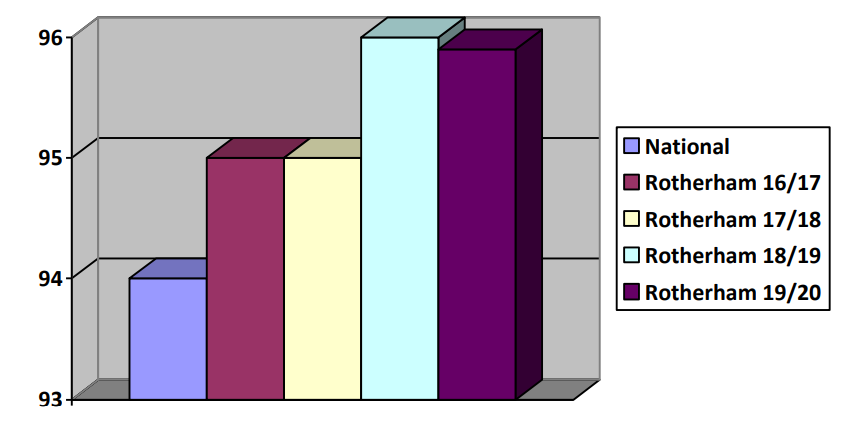
Percentage of parents who felt confident the service was impartial
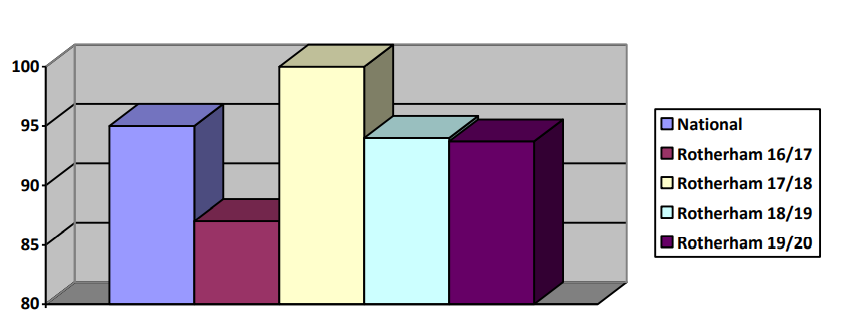
Percentage who felt the Service made a difference to their situation
Percentage who felt satisfied with the service offered
Percentage who would recommend the service to others